

In our recent LinkedIn post highlighting the increase in solar output this year – a near 22% gain in Western Europe – we considered some of the drivers that contributed to that result.
Now we dive a little deeper and unpick what the real increase could have been, and the factors affecting this.
To recap, the pace of solar capacity deployment accelerated in 2022 as the energy crisis unfolded across Europe, and households sought to limit their electricity bills.
Despite the growth rate subsequently stabilising, the overall high level of capacity addition has been maintained, with Germany setting a new annual record of around 17GW in 2024.
German government policy has traditionally been supportive of renewable energy, with the country now accounting for over a quarter of European solar capacity and being the biggest annual installer in four out of the past 5 years.
Outside Germany, the geographic focus of new installations has shifted: from growth at the start of the crisis in Belgium and Netherlands; to increases more recently in Spain, Italy and France.
The nature of installations has also shifted, with growth in the residential sector slowing as energy prices fall and incentives expire, while, as the relative cost of panels and storage continues to decline, large utility and industrial scale projects have increased.
Pricing
Solar output growth has been a major driver of European summer power prices in recent years, and due to the sheer volume of solar capacity in Europe there are many (and rising) summer daylight hours at zero or negative prices.
With this trend likely to continue, it’s probable that policy changes mean an increasing proportion of new installations will not be incentivised to produce at negative prices.
Capacity vs output
During zero or negative pricing occurrences, some, typically larger solar installations are disincentivised from producing, while residential installations are usually unaffected by negative pricing and continue to input into the grid.
An additional factor that limits output can be grid bottlenecks or physical requirements. Extreme examples of this were seen in Spain – after the late April blackout the grid became much more active turning down solar and increasing CCGT output. This is slowly dissipating, although still raised from pre-blackout levels.
The chart below estimates in recent months how much more solar could have been generated if demand was high enough to maintain positive prices and the grids operated with no constraints.
Solar turndowns: W Europe
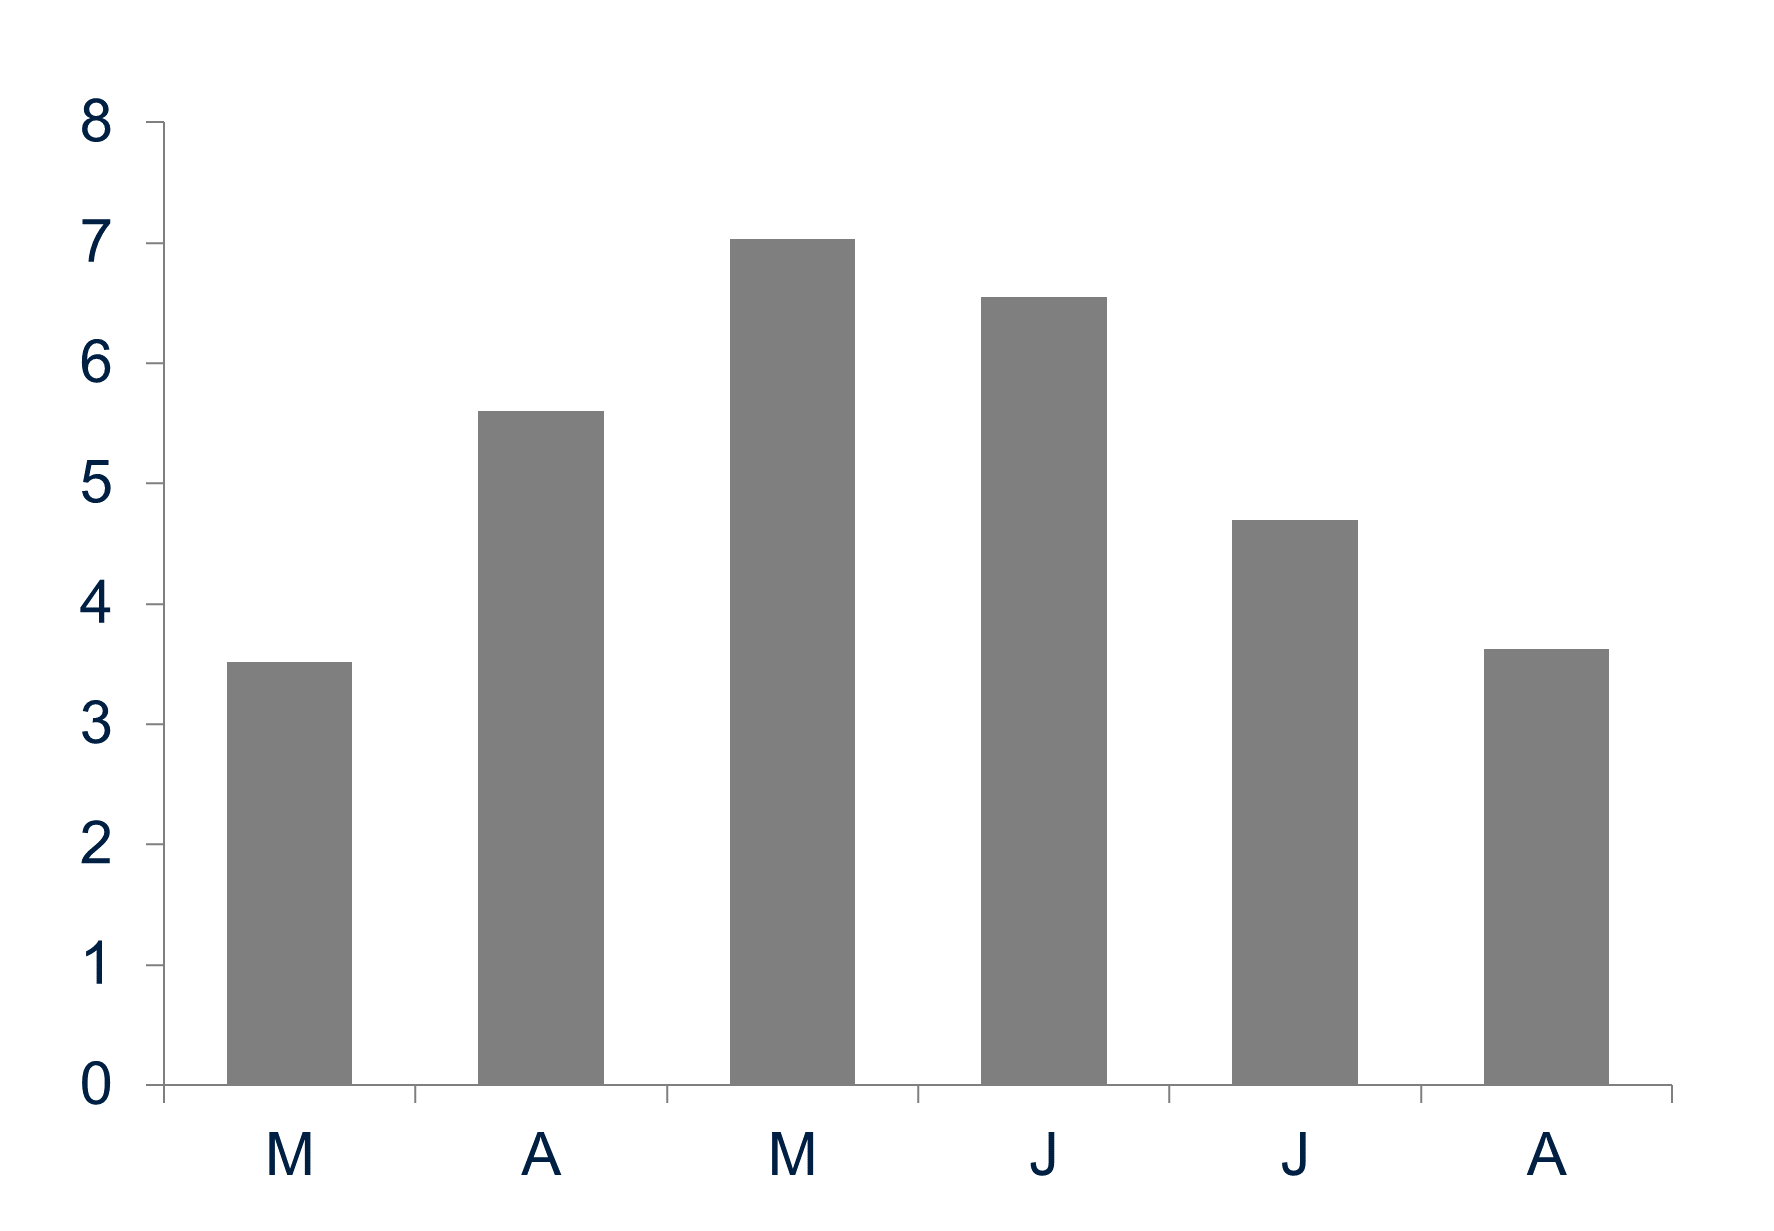
Daily average GW / estimate / 2025
A continuing trend
The amount of ‘turndowns’ is likely to continue increasing over the next few years, with demand growth and BESS installations expected to continue lagging solar installations.